
How Do TV Ratings Work? Nielsen Ratings Explained

Every year, a perfectly good show gets canceled and everyone loses their mind. The fans riot on social media, the cast posts teary goodbyes, and the same question comes up everywhere: who exactly is deciding this? So let’s answer it properly. How do TV ratings work, who is doing the counting, and why does a tiny fraction of viewers seem to control the fate of everything on television? The short version is that ratings are estimates built from carefully selected sample groups, and those estimates carry enormous financial weight. The longer version is way more interesting — and it involves decades of evolution from paper diaries to the streaming era we live in now.
I have been obsessively reading ratings reports for years, partly because I love television and partly because nothing is funnier than watching the internet rage at a decision that was actually made by cold, hard math. Here is the thing most people miss: ratings are not a vote. They are a measurement. Nobody is asking your opinion. They are watching what you watch — or, more precisely, watching what a few thousand carefully chosen households watch, and projecting that onto the entire country. Let me walk you through exactly how that works, from the famous Nielsen panels to the weird new world of streaming numbers, where the rules are completely different.
How Do TV Ratings Work? The 60-Second Version
TV ratings estimate how many people watch a show. A company like Nielsen picks a sample of households that statistically represents the whole viewing population, measures exactly what those households watch using electronic meters, and then scales those numbers up. If the sample is right, the estimate is remarkably close to reality. Networks and advertisers pay for these estimates because they need to know what people are actually watching — and what that attention is worth.
Two terms matter more than any others: rating and share. The rating is the percentage of all TV households watching a program. The share is the percentage of households that actually have the TV on at that time who are watching it. A 5.0 rating with a 10 share means five percent of all TV households tuned in, which was ten percent of everyone watching TV right then. Ratings decide ad prices, renewals, and cancellations. That is why the industry guards them like state secrets and fights over them like money — because they literally are money.
The Nielsen Panel: A Few Thousand Households Represent Millions
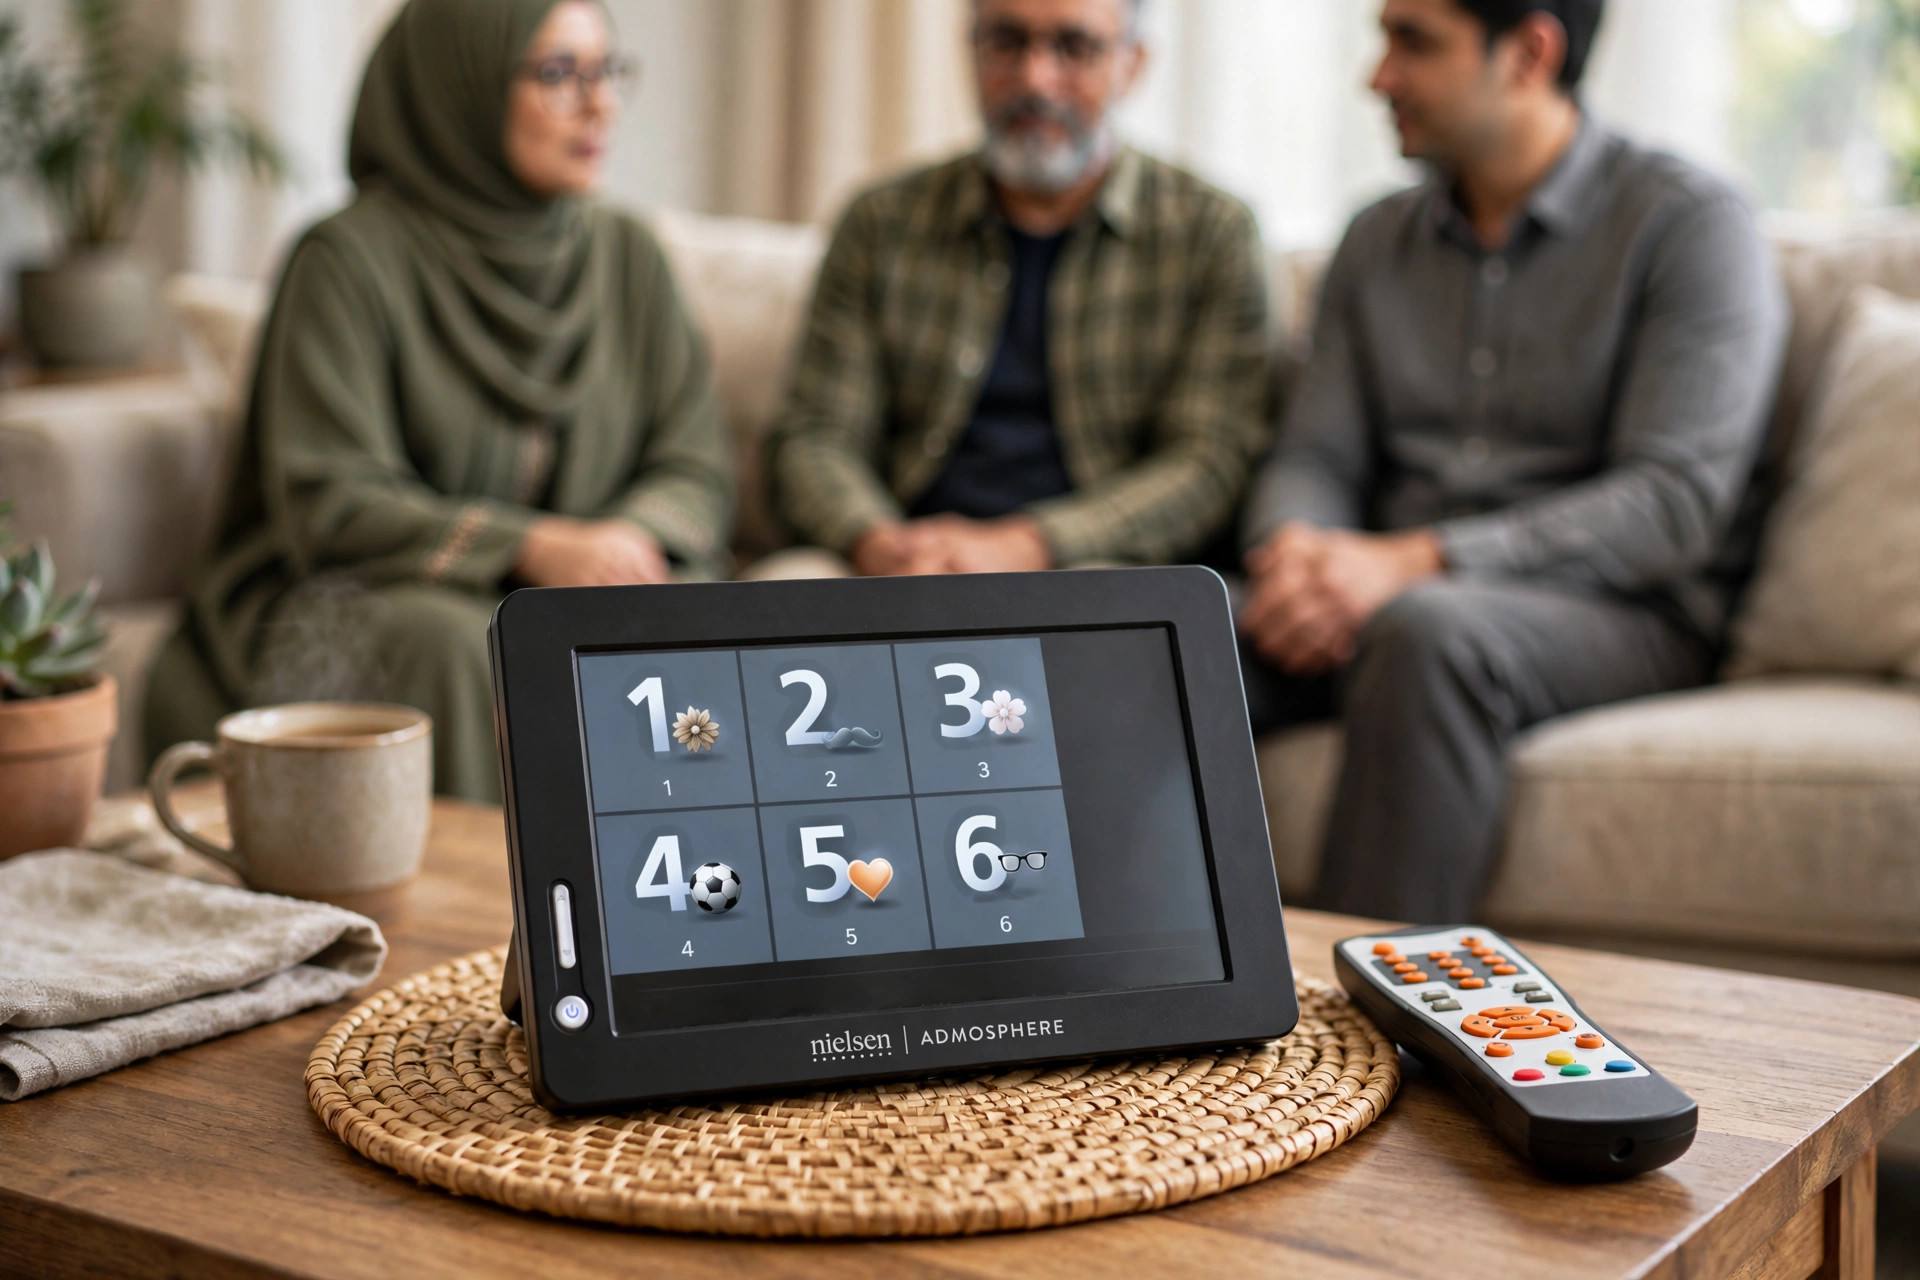
The core of the whole system is the panel. Nielsen recruits households across the country — tens of thousands of them — chosen so their mix of ages, races, income levels, and locations mirrors the actual population. These households agree to have their viewing measured, and Nielsen uses meters to track what is playing on their TVs and, through viewer buttons or sound-matching technology, who in the household is watching.
This is where most people’s brains break: how can forty thousand homes possibly speak for a hundred million? The answer is statistics, and honestly, it works. Political polls do the exact same thing with a thousand phone calls. When the sample is built correctly and the math is done right, a small, representative sample predicts the population with surprising accuracy. It is not perfect — no measurement is — but it is consistent, which is what advertisers actually need. They do not need truth. They need a number everyone agrees on, so they can buy and sell airtime without arguing about whose numbers are real.
The panel approach does have genuine weaknesses, and you should know them. Panel households know they are being measured, which can subtly change behavior. Certain groups are harder to recruit and keep in panels, especially young people and some demographics. And panel-based measurement was built for appointment television — everyone watching the same thing at the same time — which is exactly the viewing habit streaming has been destroying for fifteen years. Keep that in the back of your mind, because it matters for everything below.
Rating vs. Share vs. Total Viewers: What Each Number Means
Let us untangle the vocabulary, because industry people throw these terms around like everyone majored in statistics. The rating, as I said, is the percentage of all TV households. The share is the percentage of TVs actually in use. Then there is total viewers, the raw headcount estimate, which is what headlines usually quote because millions sound more impressive than a 2.3 rating.
There is also the demo that rules everything: adults 18 to 49, often just called “the demo.” Advertisers prize younger viewers because they spend more and are harder to reach through traditional channels, so a show can have modest total viewership and still be a hit if its 18-49 number is strong. This is why beloved shows with older audiences sometimes get axed while younger-skewing shows survive — the demo is where the money lives. I have strong feelings about this, and I will keep most of them to myself.
You will also hear about C3 and C7 ratings. These measure commercial viewing within three or seven days of the original airdate, and they are the numbers advertisers actually pay against, because networks want credit for everyone who watched the ads, not just the live audience. The days of everyone watching live are long gone. Time-shifted viewing — DVRs, on-demand, catch-up apps — is a huge chunk of the audience now, and the ratings system had to evolve to capture it.
How Ratings Get Collected: Diaries, Meters, and Return-Path Data
The collection methods are a timeline of technology. It started with paper diaries: panel households wrote down what they watched, in fifteen-minute increments, for a week. Think about that. People were expected to remember and hand-write their viewing. It was crude, it relied on memory, and it was embarrassingly easy to misremember or misreport — but it was the best anyone had for decades.
Then came the people meter: an electronic box on top of the TV where each household member pushed their own button when they started and stopped watching. Passive measurement of what played, active logging of who watched. This was a huge leap in accuracy, though it introduced the classic problem of people forgetting to push the button — or the designated button-pusher logging viewing for the whole family while half of them were on their phones.
The modern stack layers several methods. Return-path data comes from set-top boxes and smart TVs — millions of devices reporting what is playing, without anyone pushing buttons. This is big data, not a panel: massive scale, but with its own biases, since it only covers homes with compatible devices and tends to undercount certain viewing. Nielsen and its competitors combine panel data (small but representative) with big-data feeds (huge but skewed) to get numbers that are both large-scale and statistically grounded. It is messy, it is expensive, and the entire television economy runs on it.
Who Uses Ratings and Why They Matter So Much
The short answer: everyone with money involved. Advertisers buy airtime based on ratings — a 30-second spot on a show with a 3.0 rating costs a multiple of the same spot on a 0.8 show, because the advertiser is buying eyeballs. Networks set schedules, decide renewals and cancellations, and justify their existence to shareholders using ratings. Producers and talent negotiate salaries against them. Even streaming platforms — which publish almost no ratings — quietly use internal viewing data to make the same greenlight-or-cancel calls.
This is why cancellations feel so cruel and arbitrary. A show you love might have genuinely excellent ratings among its target demo and still die because the production cost per viewer was too high, or because the network wants the time slot for something it owns outright. Ratings are the biggest single input, not the only one. The business behind the art is always doing math you cannot see.
It is also why the industry obsesses over premiere nights and season finales. Big events concentrate the audience into measurable moments. A show that builds slowly over a season is lovely for viewers and a nightmare for schedulers, because the ratings story it tells is complicated. Networks would rather have a big, simple number than a subtle, complicated one. Always.
The Streaming Problem: Why Netflix and Disney+ Changed Everything
Here is where the classic ratings system starts to wobble. Streaming services do not sell advertising in the traditional sense — or at least, most of them did not at first — so they had no reason to participate in a shared, third-party ratings system. Instead, they measure viewing themselves, with their own definitions, and they publish almost nothing. When Netflix says a show was watched 80 million times, you are taking their word for it, and you have no idea what “watched” means. Two minutes? The whole series? One episode? They have changed the definition more than once, and each time, the numbers went up. Funny how that works.
This created a strange situation: the biggest players in television are the least transparent about viewership. Nielsen launched streaming measurement products to try to capture this — measuring streaming the same way it measures linear TV, with panels plus device data — and the numbers it publishes are the closest thing the industry has to a shared streaming scoreboard. But the platforms’ own internal data remains the real currency for renewal decisions, and the public only ever sees the highlights reel.
Ad-supported tiers are slowly changing the game. As streamers add ad tiers, advertisers demand verified numbers again, and the pressure to join shared measurement systems grows. We are drifting toward a future where ratings cover everything — linear, DVR, streaming, all of it — but we are not there yet. Right now, the truth is fragmented: panel ratings for broadcast, platform self-reports for streaming, and a whole lot of trust-me energy in between. If you want to understand how Netflix recommendation algorithms decide what you watch, that is a separate piece of the puzzle — the measurement tells them what worked; the algorithm decides what you see next.
What Ratings Can’t Tell You (and Why That Matters)
Ratings measure attention, not love. A show can have enormous ratings and a fandom that is completely checked out, or modest ratings and a fanbase that will buy merchandise, evangelize to friends, and show up for a movie sequel ten years later. Ratings do not measure cultural impact, they do not measure devotion, and they definitely do not measure whether something is good. They measure whether people turned it on.
They also do not tell you why. A rating tells you that ten million people watched. It does not tell you whether they watched because they loved it, because they hate-watched it, because it was on after the football game, or because the remote was across the room. The industry has entire secondary industries — social listening, surveys, focus groups — trying to answer the why, precisely because the ratings cannot.
And in the streaming era, ratings struggle with the long tail. A show that nobody talks about in its premiere week can accumulate a huge audience over months of quiet bingeing. Traditional ratings are built for moments; streaming audiences build slowly. The measurement systems are still catching up to how people actually watch. Meanwhile, how live streaming works has its own measurement challenges, since live audiences on the internet behave nothing like traditional broadcast audiences.
Frequently Asked Questions
What is a Nielsen rating?
A Nielsen rating is the audience estimate produced by Nielsen, the dominant TV measurement company. It estimates the percentage of TV households watching a program, based on a representative panel of measured households combined with large-scale device data. “Nielsen rating” has become shorthand for TV ratings generally, the way “Kleenex” means tissue.
What is the difference between a rating and a share?
The rating is the percentage of all TV households watching a show; the share is the percentage of households with the TV on at that time watching it. A show can have a low rating but a high share if few people are watching TV overall — common for summer programming or late-night slots.
Why do shows with fans still get canceled?
Because ratings measure audience size, not audience passion. A show with a small but devoted fanbase loses the math against a cheaper show with a bigger casual audience. Production cost, ad revenue from the demo, and ownership of the content all factor into the decision alongside raw ratings.
How do streaming services measure views?
Streaming platforms track viewing internally through their own apps — every play, pause, and completion is logged server-side. They define “a view” however they choose and publish selected numbers as marketing. Third parties like Nielsen also estimate streaming viewership through panels, but platform self-reported numbers are not independently audited the way traditional ratings are.
Can a small sample really represent all viewers?
Yes, if it is built correctly. A representative sample of tens of thousands of households can estimate national viewing within a small margin of error — the same statistical principle behind election polling. The method has real limitations, especially with hard-to-reach demographics, but the industry accepts it because it produces consistent, agreed-upon numbers.