How Do Opinion Polls Work? A Clear Explainer



Every election season, we’re drowning in them: candidate A leads by three points, approval ratings tick up or down, “a new poll shows…” followed by confident punditry. But how do opinion polls work, really? How does asking a thousand strangers predict what millions will do — and why do polls sometimes get it spectacularly wrong? As someone who’s covered polling for years, let me pull back the curtain.
The short answer: a good poll is applied statistics, carefully done. The longer answer involves sampling theory, human psychology, and a lot of judgment calls — and understanding those judgment calls is what separates people who read polls well from people who get fooled by them.
How Do Opinion Polls Work? The Core Idea: Sampling
Polling rests on one powerful mathematical insight: you don’t need to ask everyone to know what everyone thinks — you just need to ask a representative slice. If you randomly select 1,000 voters from an electorate of millions, the laws of probability say their opinions will closely mirror the whole, within a calculable margin of error. This isn’t guesswork; it’s the same math that lets a chef taste a spoonful of soup instead of drinking the pot.
The key word is random. Not “whoever picks up the phone” or “whoever clicks the link” — a proper random sample where every member of the target population has a known chance of being selected. In practice, true randomness is hard, so pollsters use methods like random digit dialing, address-based sampling from postal records, or carefully recruited online panels. The quality of the sample is the quality of the poll; everything else is refinement.
Sample size matters, but less than people think. The jump from 400 to 1,000 respondents meaningfully shrinks the margin of error; the jump from 1,000 to 4,000 barely moves it while quadrupling the cost. That’s why most serious polls land around 800–1,200 respondents — it’s the sweet spot where the math and the budget agree.
Weighting: Fixing the Sample’s Imperfections
No real-world sample is perfectly representative. Young people answer phones less; certain demographics are harder to reach; some groups are more willing to talk to pollsters. So pollsters weight the results — mathematically adjusting the sample to match the known demographics of the population.
Here’s a simplified example: if census data says a state’s electorate is 15% Latino but your sample came back only 10% Latino, each Latino respondent’s answers get weighted up so the final result reflects the true 15%. Standard weighting targets include age, gender, race, education, and geography. Good weighting is transparent — reputable pollsters publish their targets and methods.
But weighting involves assumptions, and assumptions are where polls can go sideways. To weight correctly, you have to know what the electorate will actually look like — and in a changing electorate, that’s itself an educated guess. Weight by the wrong turnout model and you can produce a precise, confident, wrong number. This is one of the main suspects in famous polling misses: not bad math, but bad assumptions fed into good math.
Margin of Error: What It Really Means
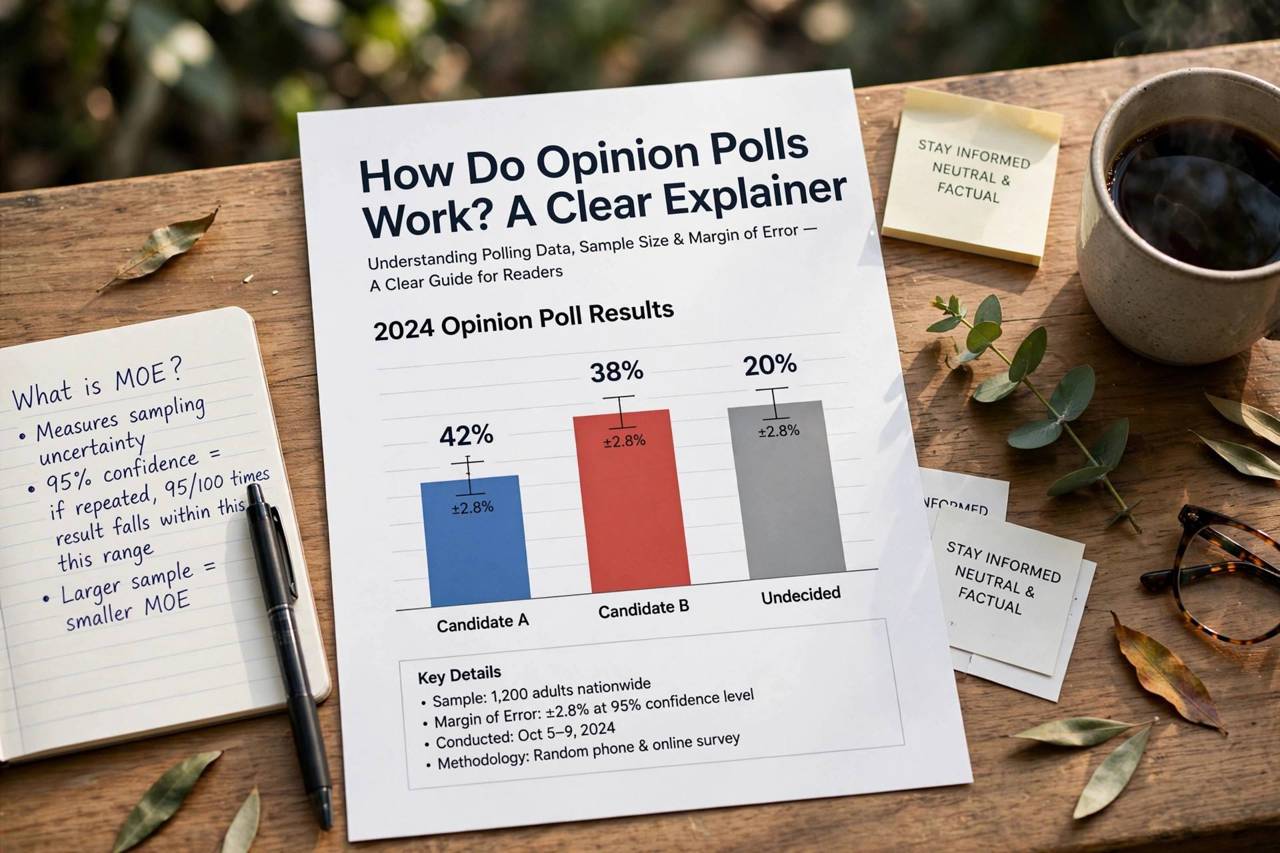
Every honest poll comes with a margin of error, usually around ±3 percentage points for a 1,000-person sample. Here’s what that actually means: if a poll shows Candidate A at 48% with a ±3 margin, the pollster is 95% confident the true number is between 45% and 51%. Not certain — 95% confident. One time in twenty, the true value falls outside even that range, through no fault of anyone’s.
The most misunderstood consequence: when two candidates are within the margin of error of each other, the poll is effectively saying “too close to call” — not “Candidate A is winning.” A 48–45 lead with a ±3 margin means the race could genuinely be tied, or either candidate could be ahead. Headlines that declare a leader from such numbers are misreading their own data.
And the margin of error only covers sampling error — the randomness of who got picked. It doesn’t cover the other errors: bad weighting assumptions, people lying to pollsters, likely-voter screens that misjudge turnout. The true uncertainty of a poll is always larger than the printed margin. Treat the margin of error as a floor, not a ceiling.
How Polls Go Wrong
Polls miss for a handful of recurring reasons, and knowing them makes you a smarter consumer. Nonresponse bias is the big structural one: response rates have collapsed over the decades, and the people who do answer polls increasingly differ from those who don’t. If supporters of one candidate systematically hang up on pollsters, every poll will lean the other way no matter how good the math is.
Shy respondents are the famous cousin of this problem — people who won’t admit their true preference to a stranger, whether from social pressure or distrust. Pollsters try to detect this with clever question design, but it’s inherently hard to measure what people won’t say.
Likely-voter screens cause trouble in elections specifically. Polls of “all adults” and polls of “likely voters” can tell very different stories, and deciding who’s likely to vote involves modeling — past voting history, stated enthusiasm, demographic patterns. Get the turnout model wrong and the poll is wrong, even if every respondent answered honestly.
Herding is the industry’s own embarrassing habit: pollsters tweaking their assumptions to match competitors’ results, because being wrong alone is scarier than being wrong together. It compresses the range of published polls and creates false confidence. When every poll agrees, that’s sometimes evidence — and sometimes just peer pressure.
Reading Polls Like a Professional
So how should you actually consume polling? First, look at averages, not individual polls. A polling average smooths out the noise and the house effects of individual pollsters; one outlier poll means little, but a consistent average means a lot. Second, check the pollster’s track record and transparency — do they publish their methods, sample sizes, and weighting targets? Reputable pollsters do.
Third, mind the dates. A poll is a snapshot, not a forecast — it describes opinion when the interviews happened, which may be days or weeks before publication. Old polls in a fast-moving race are history, not news. Fourth, compare like with like: registered voters versus likely voters, adults versus voters, different question wordings — these aren’t interchangeable, and mixing them creates phantom trends.
Finally, keep the uncertainty front and center. A polling average showing a two-point lead with weeks to go is not a prediction — it’s a coin flip with extra steps. The honest summary of most close races is “too close to call,” and anyone telling you otherwise is selling certainty the data doesn’t contain. Polls are powerful tools for understanding public opinion. They’re just not crystal balls, and respecting their limits is what makes them useful.
One more professional habit: watch for the trend, not the number. A candidate moving from 44 to 47 across several polls over a month tells you something real about momentum; a single poll showing 48 tells you almost nothing by itself. Direction sustained over time, confirmed by multiple pollsters, is the closest thing polling gives you to a reliable signal. Everything else is noise wearing a suit. Learn to spot the difference and you’ll never be fooled by a single flashy headline number again. That skill alone is worth more than a hundred hot takes, and it works for every poll you’ll ever read — elections, approval ratings, product surveys, all of it.
A Brief History of Polling: The Hits and the Misses
Modern polling was born in the 1930s, and its founding story is a famous humiliation. In 1936, the Literary Digest — then the most respected poll in America — predicted Alf Landon would crush Franklin Roosevelt, based on 2.4 million responses. It was the largest poll ever conducted, and it was catastrophically wrong. George Gallup, using a far smaller but properly random sample of 50,000, predicted Roosevelt’s landslide correctly. Bigger wasn’t better; representative was better. The Digest folded within two years. The lesson has echoed through every polling failure since.
The next great miss came in 1948, when pollsters stopped polling too early and missed a late swing to Harry Truman — producing the iconic photo of a grinning Truman holding the “DEWEY DEFEATS TRUMAN” headline. Then 2016, when state-level polls in key battlegrounds underestimated one candidate’s support, partly because college-educated voters (easier to reach) were overrepresented in samples. And 2020, when the errors ran even larger despite methodological fixes, forcing a genuine reckoning in the industry.
Each failure taught something real. 1936 taught sampling over size. 1948 taught timing. 2016 taught the danger of education-based nonresponse bias. 2020 taught humility — that some biases resist even careful correction. The through-line: polling keeps getting more sophisticated and keeps discovering new ways the world is messier than the models. That’s not a reason to dismiss polls; it’s the reason to read them with the informed skepticism this guide is really about.
Frequently Asked Questions
How do opinion polls work in simple terms?
Pollsters survey a random, representative sample of a population (usually 800–1,200 people), adjust the results mathematically to match known demographics (weighting), and report the findings with a margin of error reflecting the statistical uncertainty.
What is margin of error in polling?
It’s the range within which the true population value likely falls — typically ±3 points for a 1,000-person sample at 95% confidence. It covers only sampling randomness, not other errors like bad turnout assumptions, so real uncertainty is larger.
Why are polls sometimes wrong?
Common causes: nonresponse bias (certain groups don’t answer), shy respondents, incorrect likely-voter turnout models, and herding (pollsters converging on each other’s results). The math is usually fine; the assumptions feeding it are where errors creep in.
How many people need to be polled for accuracy?
Around 800–1,200 respondents is the standard sweet spot — beyond that, larger samples barely shrink the margin of error while greatly increasing cost. Representativeness matters far more than raw size.
Should I trust a single poll or a polling average?
Averages. They smooth out individual pollsters’ noise and methodological quirks. One poll is a data point; a consistent average across many polls is a signal.