


KPI stands for Key Performance Indicator — a measurable value that shows how well a company, team, or individual is doing against its goals. Revenue growth, customer retention rate, website conversion rate: these are KPIs. “Doing good marketing” is not.
I’ve sat through a hundred dashboard reviews. The companies that win don’t track more metrics — they track fewer, better ones. Most KPI systems I’ve seen are theater: 40 charts nobody reads, reviewed by nobody, changing nothing. This guide is about the opposite: KPIs that actually drive decisions.
Table of Contents
- The One-Sentence Definition (And Why It Matters)
- KPI vs Metric: The Distinction Everyone Gets Wrong
- The Main Types of KPIs
- How to Choose the Right KPIs (The 5-Second Test)
- KPI Examples by Department
- The 4 Ways Companies Ruin Their KPIs
- Frequently Asked Questions

The One-Sentence Definition (And Why It Matters)
A KPI is a number you would change your behavior based on.
That’s the whole test. If a metric moves 20% and nobody does anything differently, it’s not a key performance indicator — it’s a vanity decoration. “Page views” on a company blog that sells enterprise software? Decoration. “Demo requests per week” for that same company? That’s a KPI, because a drop means someone picks up the phone and fixes the funnel.
This distinction matters because measurement is expensive. Every KPI costs attention: someone collects it, someone reviews it, someone explains it in a meeting. A company tracking 50 KPIs is really tracking zero — human attention doesn’t scale that way. The right number for most teams is 3-7.
KPI vs Metric: The Distinction Everyone Gets Wrong
All KPIs are metrics. Not all metrics are KPIs. The difference is decision relevance.
- Metric: any quantified measurement. Bounce rate, headcount, office temperature.
- KPI: a metric tied to a strategic goal, with a target and an owner. “Reduce customer churn from 8% to 5% by Q4, owned by the success team.”
Here’s a practical way to think about it: metrics are the raw ingredients; KPIs are the dish you’re actually serving at the strategy table. A warehouse tracks hundreds of metrics (units picked per hour, aisle congestion). Its KPIs might be just three: order accuracy, on-time shipment rate, and cost per order.
The confusion costs real money. I’ve seen startups pay for analytics platforms to track 60 “KPIs” when the only three numbers that mattered were burn rate, revenue growth, and churn. Everything else was noise with a subscription fee.
The Main Types of KPIs
KPIs cluster into a few families. Knowing which family you’re in keeps you from comparing apples to aircraft carriers.
Financial KPIs
The money numbers: revenue, gross margin, net profit, cash flow, burn rate, customer acquisition cost (CAC), lifetime value (LTV). Every business watches these; the mistake is watching only these. Financial KPIs are lagging — they tell you what already happened.
Customer KPIs
How the market responds: retention rate, churn rate, Net Promoter Score (NPS), customer satisfaction (CSAT), repeat purchase rate. These are closer to leading indicators — a churn spike today predicts a revenue dip next quarter.
Operational KPIs
How the machine runs: order fulfillment time, production defect rate, employee productivity, inventory turnover. Unsexy, but this is where margins are won or lost.
Marketing and Sales KPIs
Pipeline metrics: conversion rate, cost per lead, sales cycle length, marketing-qualified leads. The classic failure here is celebrating lead volume while ignoring lead quality — 1,000 leads that never buy are worse than useless; they waste sales time.
Employee and HR KPIs
Retention, absenteeism, time-to-hire, engagement scores. Leading indicators of operational trouble: when good people start leaving, the financial KPIs will follow in 6-12 months.
How to Choose the Right KPIs (The 5-Second Test)
For each candidate KPI, ask: “If this number moved 20% tomorrow, would we do something different?”
If yes — it’s a KPI. If the answer is “we’d mention it in the meeting,” it’s not.
Then apply three more filters:
1. One owner. Every KPI needs a name attached — someone whose job it is to move it. Shared ownership means no ownership.
2. A target and a timeframe. “Increase conversion” is a wish. “Increase trial-to-paid conversion from 12% to 18% by end of Q3” is a KPI. Without a target, you can’t tell success from drift.
3. Measurable without heroics. If getting the number requires three spreadsheets and a prayer, it won’t get measured. The best KPI is one your existing systems already produce.
A startup I advised cut their dashboard from 34 metrics to 6 using exactly this process. Revenue decisions got faster within a month — not because the data changed, but because people finally looked at the same six numbers every week. If you’re building something new, start with our breakdown of what a startup actually is — the KPI discipline is the same whether you’re three people or three thousand.
KPI Examples by Department
Concrete examples, because abstract advice doesn’t survive contact with Monday morning:
Sales team
– Monthly recurring revenue (MRR) growth — target: +8% MoM
– Win rate (deals won / deals quoted) — target: 25%+
– Average sales cycle length — target: under 30 days
Marketing team
– Customer acquisition cost (CAC) by channel — target: under $120
– Lead-to-customer conversion rate — target: 4%+
– Organic traffic growth — target: +15% QoQ
Product team
– Feature adoption rate — target: 40% of active users in 30 days
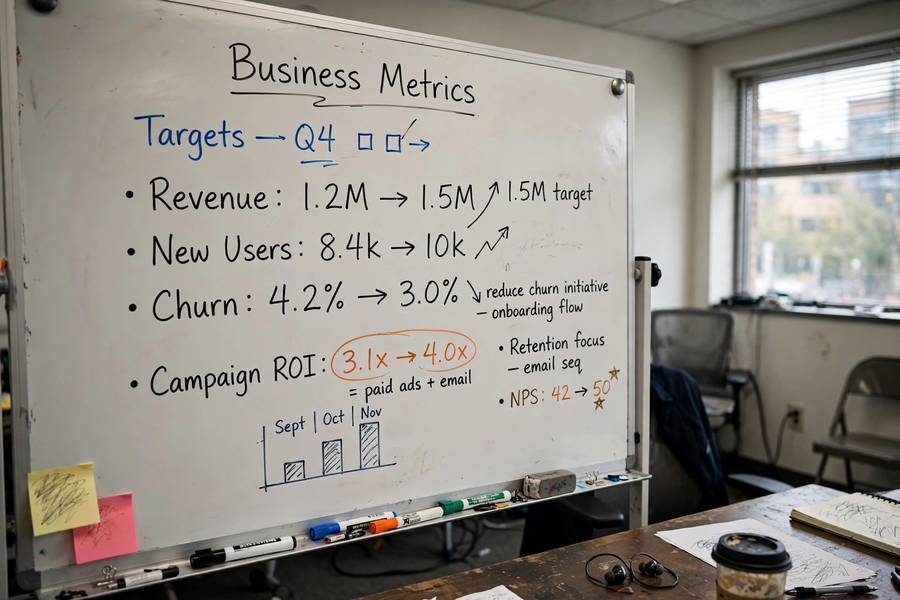
– Churn rate — target: under 5% monthly
– NPS — target: 50+
Support team
– First-response time — target: under 2 hours
– Resolution rate on first contact — target: 70%+
– CSAT — target: 90%+
Finance
– Gross margin — target: 70%+
– Burn multiple (net burn / net new revenue) — target: under 2x
– Runway — target: 18+ months
Notice each has a target. A number without a target is trivia. And if you’re the one setting these targets, the entrepreneurial judgment in how to become an entrepreneur applies — targets are bets, and good founders make explicit bets.
The 4 Ways Companies Ruin Their KPIs
1. Too many. The 40-chart dashboard. Fix: ruthless cut to the 5-second-test survivors.
2. Gaming the metric. When a measure becomes a target, it ceases to be a good measure (Goodhart’s Law). Call centers measured on call length get agents who hang up fast — and furious customers. Always pair efficiency metrics with quality metrics.
3. Set-and-forget. KPIs chosen in January are irrelevant by July if the strategy shifted. Review the KPI set quarterly: does each one still tie to what we’re actually trying to do?
4. No action attached. A KPI that flashes red with no response plan is an alarm nobody answers. For each KPI, define in advance: at what threshold do we act, and what’s the first action?
Get this right and KPIs become what they’re supposed to be: the instrument panel of the business, not the wallpaper. For more operational thinking, browse our Business guides.

Frequently Asked Questions
KPI stands for Key Performance Indicator — a measurable value that shows how effectively an organization, team, or individual is achieving its goals. Common examples include revenue growth, customer retention rate, and conversion rate.
Most teams should track 3-7 KPIs. More than that dilutes attention and nothing gets acted on. Each KPI should pass the test: “If this moved 20%, would we change our behavior?”
All KPIs are metrics, but not all metrics are KPIs. A metric is any quantified measurement; a KPI is a metric tied to a strategic goal, with a defined target, timeframe, and owner — chosen because it drives decisions.
Lagging KPIs measure past results (revenue, profit) — easy to measure but hard to change. Leading KPIs predict future results (pipeline volume, trial signups) — harder to pick but far more actionable. Healthy dashboards include both.
For most small businesses: monthly revenue growth, gross margin, customer acquisition cost, and repeat purchase or retention rate. Four numbers, reviewed weekly, each with an owner and a target — that beats a 40-chart dashboard every time.