

A confession from someone who analyzes data for a living: I used to dread the first hour of any analysis project. The data cleaning, the formula wrestling, the “why won’t this pivot table do what I want” phase. It was necessary, skilled work — and it was also toil. AI hasn’t replaced the thinking part of analysis. But it has nearly eliminated the toil part, and that changes what an analyst’s day looks like.
I’ve spent the last year running real work datasets through every serious AI analysis tool — spreadsheet copilots, conversational analysis assistants, AI visualization builders. Some were revelatory. Some produced beautiful charts of complete nonsense. This guide covers what actually works, organized by task, with the verification discipline that separates useful AI analysis from expensive fiction. The broader playbook: how to use AI at work.
Table of Contents
- What AI Is Actually Good At in Analysis
- Spreadsheet Copilots: Formulas in Plain English
- Conversational Analysis: Ask Questions, Get Answers
- AI Visualization: Charts Without the Fiddling
- Data Cleaning and Preparation
- The Verification Discipline (Read This Twice)
- What AI Gets Wrong in Analysis
- Building an AI-Assisted Analysis Workflow
- Data Privacy: The Non-Negotiable Rules
- Frequently Asked Questions
What AI Is Actually Good At in Analysis
Let’s be precise about where AI helps and where it doesn’t, because the marketing blurs this badly.
AI excels at: translating intent into technical execution (formulas, queries, chart code), exploratory pattern-finding (“what’s interesting in this data?”), reformatting and cleaning messy data, explaining existing analyses in plain language, and generating first-pass summaries and visualizations.
AI is unreliable at: statistical judgment, causal reasoning, understanding your business context, and knowing when the data itself is the problem (garbage in, confident garbage out).
The pattern: AI accelerates the mechanical layer — the doing — while the judgment layer — the thinking — remains human. The tools are force multipliers for judgment, not replacements for it.
Spreadsheet Copilots: Formulas in Plain English
The most immediately useful category for most office workers.
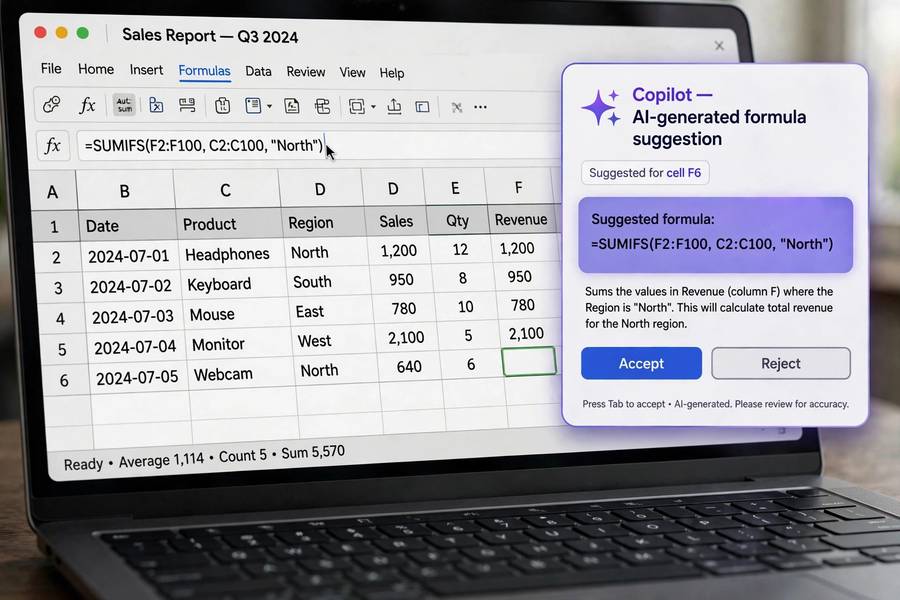
Copilot in Excel / Gemini in Sheets. Describe what you want in plain English — “calculate the month-over-month growth rate for each region, ignoring the header rows” — and get a working formula. For anyone who isn’t a spreadsheet power user, this is transformative: the gap between knowing what you want and knowing the formula syntax disappears.
What it does well: VLOOKUP/XLOOKUP constructions, conditional formatting rules, pivot table setups, data validation, text manipulation formulas. The bread-and-butter operations that used to require Googling syntax.
The critical habit: test every AI-generated formula on a small sample where you know the expected answer before applying it to real data. AI formulas are usually right and occasionally subtly wrong — wrong in ways that produce plausible-looking numbers. A formula that references column D instead of E doesn’t error; it just lies quietly. The five-minute verification saves the career-limiting presentation of wrong numbers.
Conversational Analysis: Ask Questions, Get Answers
Upload a dataset, ask questions in plain English, get analysis back. This is the category that feels most like magic — and needs the most skepticism.
How it works: tools like ChatGPT/Claude with data analysis capabilities (and dedicated platforms) accept CSVs or spreadsheets, then generate code (usually Python) to answer your questions, showing charts, tables, and summaries. “What drove the revenue dip in Q3?” becomes actual analysis — segment breakdowns, visualizations, written findings — in under a minute.
What it’s genuinely great for: exploratory analysis. The first-pass questions — distributions, trends, outliers, correlations, segment comparisons — that used to take an afternoon of coding. Asking “what’s interesting here?” and getting five genuine leads to investigate. For analysts, it’s like having a fast junior analyst who never sleeps; for non-analysts, it’s access to analysis that was previously gated behind technical skill.
The hard limit: these tools are pattern-matchers, not statisticians. They’ll compute a correlation and present it suggestively; they won’t warn you about confounding variables unless asked. They’ll fit a trend line through noise and call it insight. The analysis is fast and often right about what the data shows — and silent about what the data doesn’t prove.
AI Visualization: Charts Without the Fiddling
Good charts used to require fiddling — choosing types, formatting axes, adjusting colors, annotating. AI now handles most of this:
Describe-and-get charts. “Show me monthly revenue by product line as a stacked area chart, highlight Q3” — and it’s done, formatted sensibly. The time from question to presentation-ready visual has collapsed from 30 minutes to 30 seconds.
Chart type selection. Ask “what’s the best way to visualize this?” and get genuinely good advice — the tools know visualization principles (bar for comparisons, line for trends, scatter for relationships) and apply them correctly more often than most humans do.
What to watch: AI chooses visualizations that look good, which isn’t always what’s honest. Truncated axes, cherry-picked time ranges, misleading dual axes — the tools can produce all the classic chart crimes with beautiful formatting. Apply the same skepticism to AI charts as to human ones: check the axes, the ranges, and what’s been excluded.
Data Cleaning and Preparation
The unglamorous 80% of analysis work — and AI’s quiet superpower:
Messy data normalization. Inconsistent date formats, mixed units, trailing spaces, duplicate variants of the same category (“NYC”, “New York”, “new york”) — describe the problem, get cleaned data. What took an hour of manual fixes or tricky formulas takes a prompt.
Deduplication and matching. “Find likely duplicate customer records” — the tools handle fuzzy matching well, surfacing candidates for your review. Never auto-merge on AI judgment alone; always review the matches.
Format conversion. PDF tables to spreadsheets, nested JSON to flat tables, the weekly report that arrives as a screenshot — AI handles the format archaeology that used to eat afternoons.
This category has the best effort-to-value ratio in AI analysis: low risk, high time savings, verifiable results. If you do one thing from this guide, automate your data cleaning.
The Verification Discipline (Read This Twice)
This section is the most important in the guide. AI analysis fails in ways that look like success — the charts are beautiful, the numbers are specific, the narrative is coherent. And sometimes it’s wrong.
The verification checklist, every time:
-
Sanity-check the headline numbers. Do they match your rough expectations? A result that’s wildly surprising needs wild evidence — check it first.
-
Reproduce the key finding independently. For anything that matters, redo the critical calculation yourself or via a second method. If the AI says revenue grew 12%, verify with a manual calculation on the raw data.
-
Inspect the methodology. What did the AI actually compute? Ask it to show its work — the code, the formulas, the filters applied. “Show me the code you ran” should be your most-used follow-up.
-
Check the data, not just the analysis. AI analyzes the data it’s given, including its flaws. Duplicates, wrong date ranges, mixed units, test records left in — the AI won’t flag what it doesn’t know is wrong. Validate inputs before trusting outputs.
-
Question the framing. The AI answered the question you asked — but was it the right question? “Why did Q3 dip?” assumes the dip is real and needs explaining; maybe it’s a data artifact. Always ask “is this finding robust?” before “what does it mean?”
The rule: AI proposes, human disposes. Every insight that leaves your desk — into a deck, a decision, a discussion — must survive your independent verification. The speed AI gives you should be reinvested in verification, not pocketed as pure savings.
What AI Gets Wrong in Analysis
The recurring failure modes, so you can spot them:
Confident noise. Finding “patterns” in random variation. The AI doesn’t know your sample size is too small or your timeframe too short to support the conclusion — it just computes.
Correlation theater. Presenting correlations as insights without causal framing. “Ice cream sales correlate with drownings” energy — technically true, analytically useless, occasionally dangerous.
Overfitting the narrative. Crafting a compelling story around weak evidence. AI is a superb storyteller — which is exactly the problem when the story outruns the data.
Silent errors. The wrong join, the misaligned date, the filter that excluded half the data — producing clean output from broken process. No error message, just wrong numbers in a beautiful chart.
None of these are reasons to avoid AI analysis. They’re reasons to verify — which you’d do with a junior analyst’s work too. Treat the AI as a brilliant, fast, occasionally overconfident junior: trust the effort, verify the output.
Building an AI-Assisted Analysis Workflow
Putting it together — the workflow I actually use:
1. Define the question (human). What decision does this analysis serve? What would change your mind? Write this down before touching data — it prevents the analysis from wandering.
2. Prepare the data (AI-assisted). Clean, dedupe, validate with AI help. Inspect the cleaned output.
3. Explore (AI-led, human-directed). Conversational analysis for the first pass — distributions, trends, segments, outliers. Follow interesting threads. Note hypotheses, not conclusions.
4. Verify (human-led). Reproduce key findings independently. Check methodology. Question framing. This is where the analyst earns their title.
5. Visualize (AI-assisted). Generate charts from verified findings. Check axes, ranges, honesty.
6. Narrate (human). The story around the numbers — what it means, what to do — is yours. AI can draft; you decide.
The pattern throughout: AI accelerates execution, humans own judgment. The workflow is faster than the old one, but the human checkpoints are non-negotiable — they’re what make the output trustworthy. It’s a concrete instance of how to be more productive by automating toil rather than judgment.
Data Privacy: The Non-Negotiable Rules
Analysis data is often the most sensitive data in a company — financials, customer records, employee metrics. The rules:
Use approved tools only. Your company’s approved AI tools (enterprise tiers with data-protection commitments) for work data. Not the free chatbot. Not the cool new web app. Approved means vetted for data handling.
Know what “approved” means. Enterprise AI typically commits to: no training on your data, data encryption, retention limits, compliance certifications. Verify these for your specific tool — “enterprise” on the pricing page should map to actual contractual commitments.
Anonymize where possible. If the analysis doesn’t need names, emails, or identifiers — remove them before uploading. Aggregated or sampled data often suffices for exploratory work.
Never upload: credentials, unreleased financials (outside approved tools), personal data beyond what’s necessary, anything under NDA or regulatory restriction. When in doubt, ask your data/security team — that’s literally their job.
Remember the output too. AI-generated summaries of sensitive data are themselves sensitive. Don’t paste analysis output into unapproved tools either — the sensitivity travels with the insight.
Frequently Asked Questions
By task: spreadsheet copilots (Copilot in Excel, Gemini in Sheets) for formulas; conversational analysis (ChatGPT/Claude with data files) for exploration; AI visualization for charts and dashboards; and AI-assisted cleaning for the messy 80% of analysis work. The best tool depends on whether you’re exploring, verifying, or presenting.
AI accelerates the mechanical layer — formulas, exploration, cleaning, visualization — but can’t replace statistical judgment. It finds patterns confidently even in noise and won’t flag causal issues unless asked. Treat it as a brilliant junior analyst: trust the effort, verify every important output independently before it leaves your desk.
Sanity-check headline numbers against expectations, reproduce key findings independently, ask the AI to show its work (code/formulas/filters), validate the input data quality, and question whether you asked the right question. Every insight that goes into a decision must survive independent human verification.
Only to company-approved enterprise AI tools with contractual data-protection commitments (no training on your data, encryption, retention limits). Never upload sensitive data to free consumer tiers. Anonymize where possible, and remember that AI-generated summaries of sensitive data are themselves sensitive.