How Do Polls and Surveys Work? A Plain-English Guide


How do polls and surveys work? At their core, both try to answer the same question: what does a large group of people think, without asking every single one of them? A pollster might call 1,000 voters and claim to know what 150 million think. It sounds like magic, but it is mostly math — sampling theory, to be precise — plus a lot of careful judgment calls. The trick is knowing which polls deserve your trust and which deserve your skepticism, because not all of them are built the same.
I cover polling stories every election cycle, and I have learned that the difference between a good poll and a bad one is rarely the headline number — it is everything underneath it. Let me explain how the machinery works so you can read any poll like a pro.
Polls vs. Surveys: Is There a Difference?
In everyday language, people use the two words interchangeably, but there is a real distinction. A survey is the broader tool: a set of questions asked of a group of people, used in market research, academic studies, customer feedback, and more. A poll is a specific kind of survey — usually short, usually about public opinion or elections, and usually designed to be repeated over time so results can be tracked.
Think of it this way: every poll is a survey, but not every survey is a poll. Your airline’s “how was your flight” questionnaire is a survey. A “who would you vote for if the election were held today” questionnaire is a poll. The mechanics overlap heavily, so understanding one mostly means understanding both.
How Do Polls and Surveys Work in Elections?
It starts with sampling. Nobody can ask every voter, so pollsters select a smaller group — a sample — meant to represent the whole. The gold standard is random sampling: every member of the target population has a known chance of being selected. In practice, that means random-digit dialing of phone numbers, voter-file-based outreach, or carefully recruited online panels.
Then comes the likely-voter screen, and this is where polling becomes an art. It is not enough to ask registered voters — you need to guess who will actually show up. Pollsters ask about past voting, enthusiasm, and intention to vote, then build a model of the likely electorate. Get the model wrong and the whole poll is wrong, which is why different pollsters can survey the same race and get different answers: they are imagining different electorates.
Next is weighting. Raw samples are never perfect mirrors of the population — maybe too many college graduates answered, or too few young voters. Pollsters adjust by giving more weight to underrepresented groups and less to overrepresented ones, using census data and past election results as the target. Weighting is legitimate and necessary, but it involves assumptions, and aggressive weighting can amplify small errors.
Margin of Error: What It Really Means
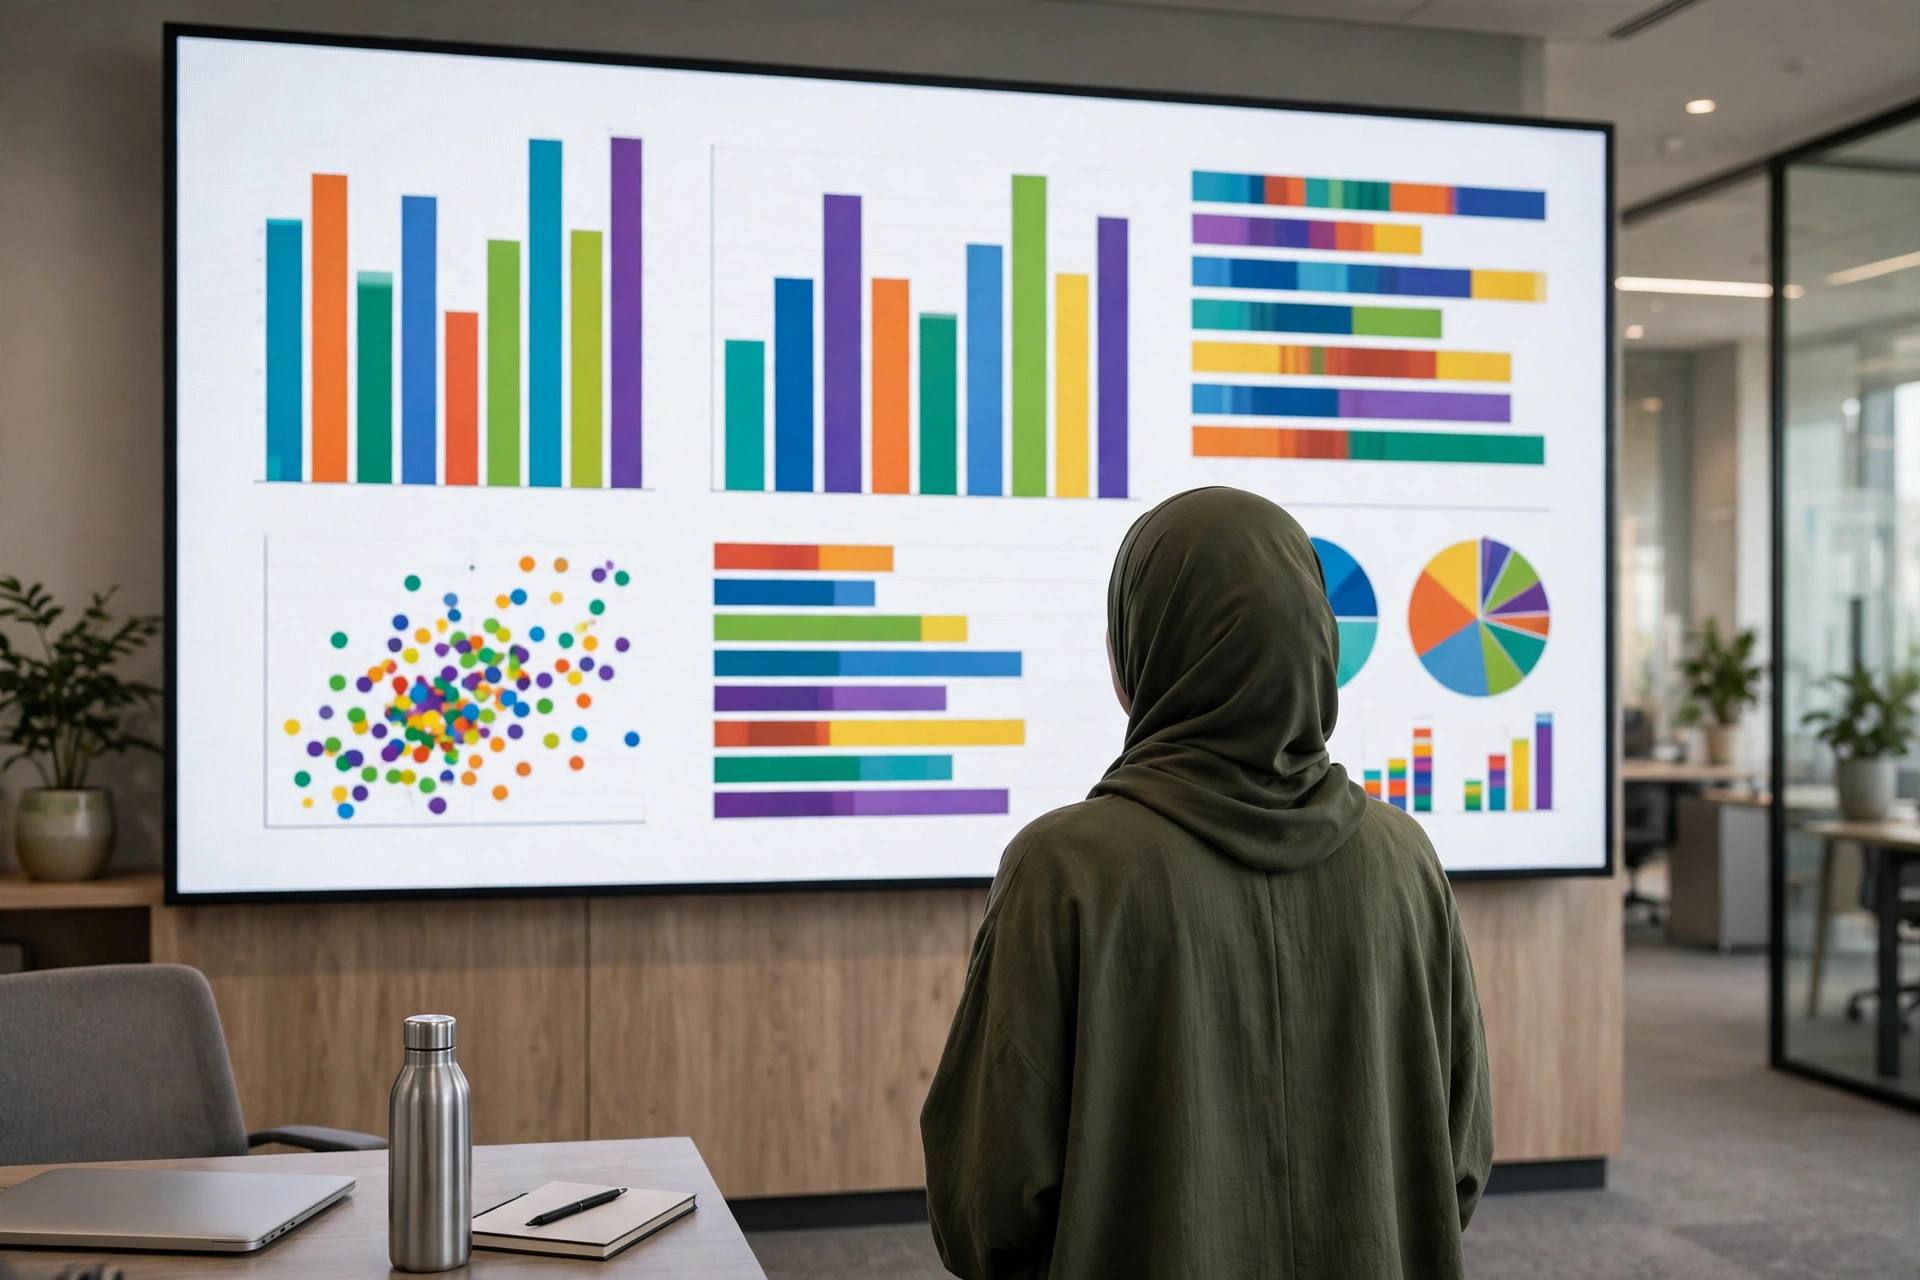
Every serious poll reports a margin of error, usually something like “±3 percentage points.” This is a statistical statement: if the poll shows a candidate at 48%, the true number is probably between 45% and 51% — if the sample was truly random and everything else was done right. That “if” carries a lot of weight.
Two things people constantly get wrong: first, the margin of error applies to each number separately, so a 48–45 lead with a ±3 margin is essentially a tie. Second, the margin of error only captures sampling error — the luck of the draw. It says nothing about bad questions, biased samples, wrong likely-voter models, or people lying to pollsters. A poll can be within its margin of error and still be badly wrong for all the other reasons.
How to Read a Poll Critically: A Checklist
Before you share or trust a poll, run through these questions. Who conducted it, and who paid for it? Campaigns and advocacy groups release polls that flatter them; independent media and academic pollsters have reputations to protect. How many people were surveyed, and when? Bigger is generally better, and dates matter — a poll from three weeks ago is history. Who was surveyed — all adults, registered voters, or likely voters? Likely-voter polls are more predictive but more model-dependent.
How were they reached? Phone polls (especially those including cell phones), high-quality online panels, and mixed methods each have strengths. Polls conducted entirely through opt-in internet pop-ups or social media are the least reliable. What exactly was asked? Question wording shapes answers enormously — “do you support the policy” and “do you support the policy despite its cost” are different questions. Serious pollsters publish their full questionnaires; if you cannot find the questions, be suspicious.
Finally, look at the average, not the outlier. One poll showing a shocking result is interesting; ten polls showing the same trend is evidence. Aggregates smooth out the noise that makes any single poll unreliable.
Why Polls Sometimes Get It Wrong
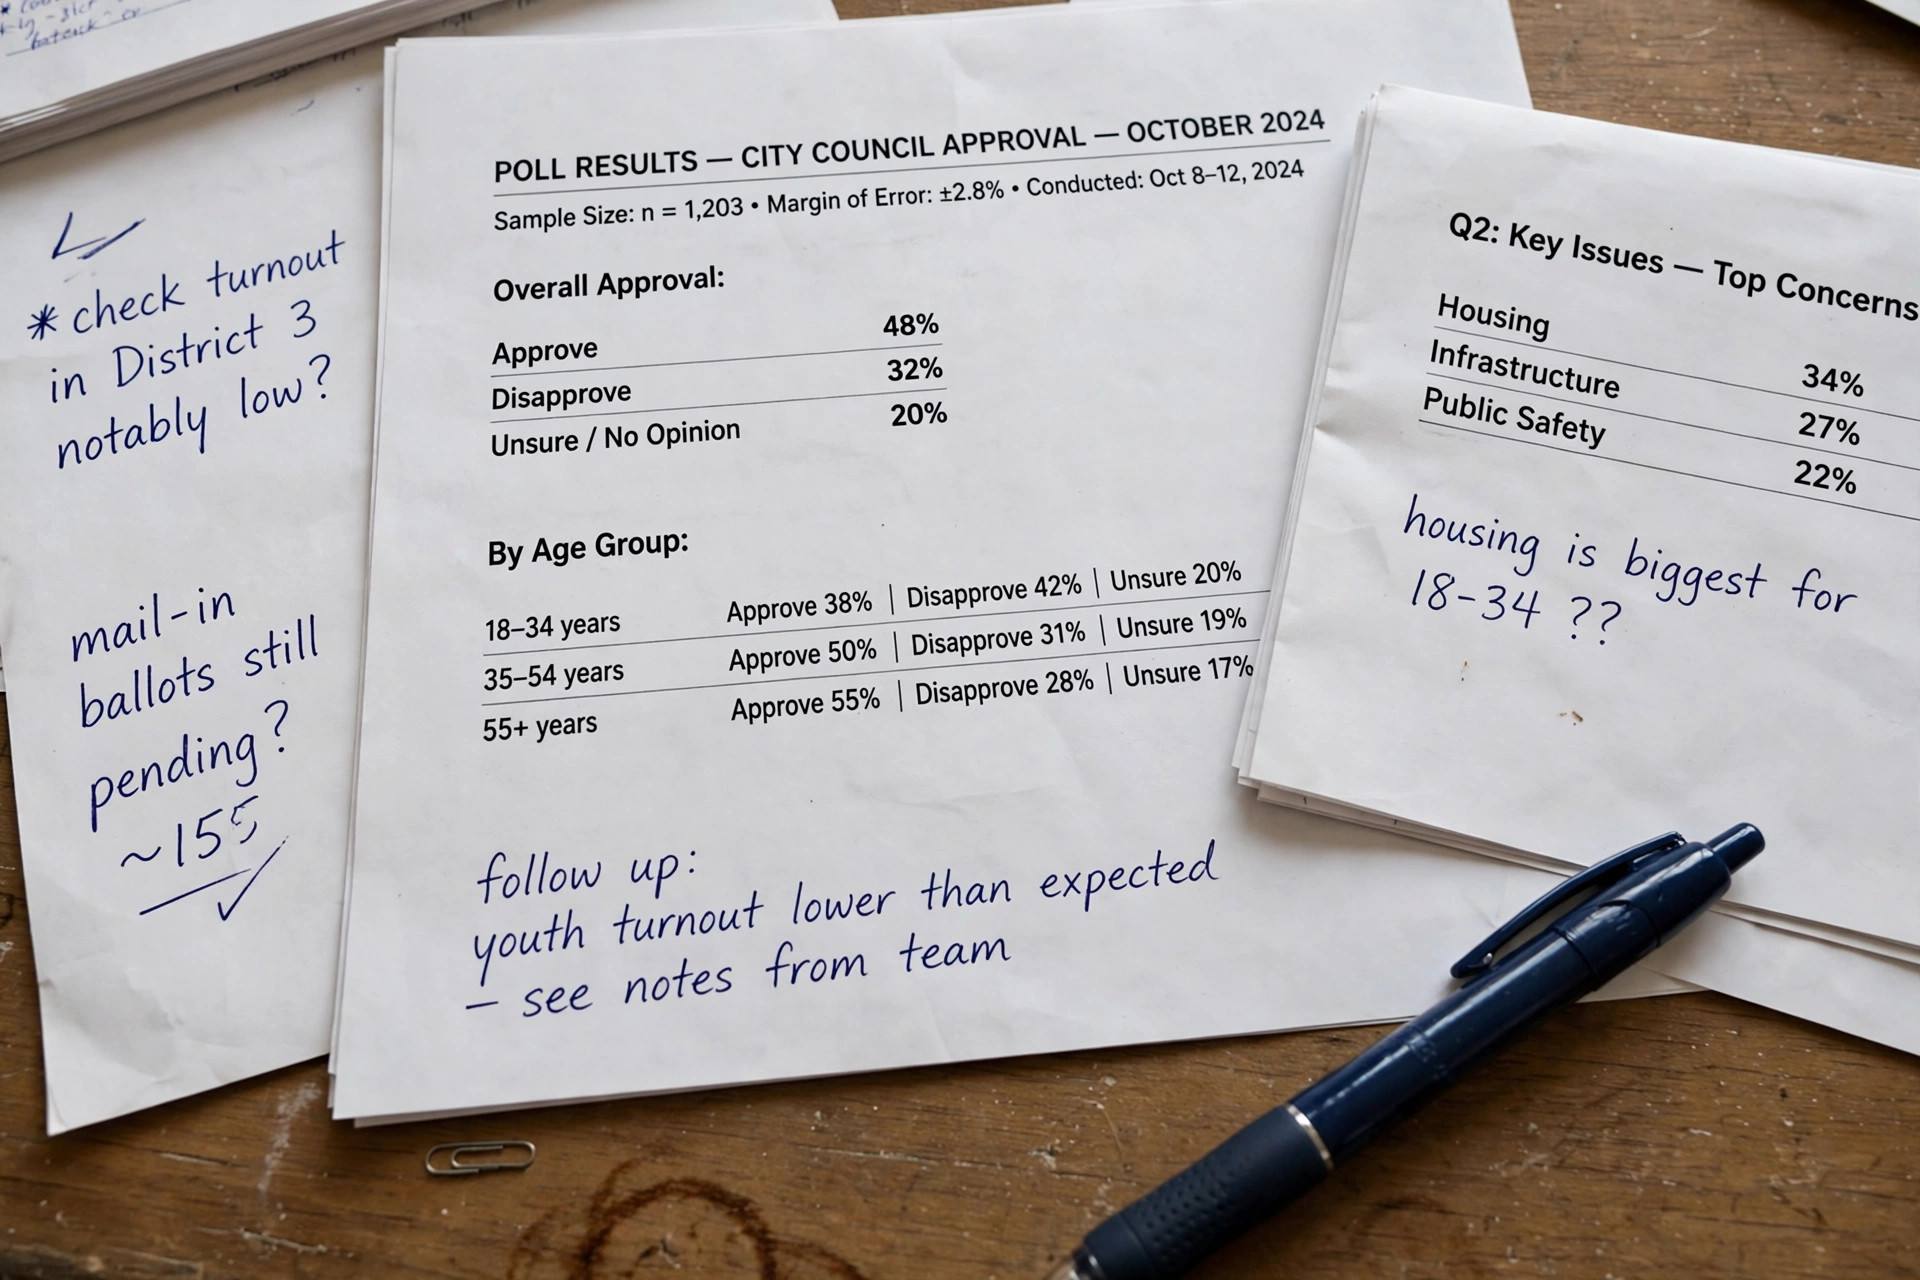
Polling has had some famous misses, and the causes are instructive. Nonresponse bias is the big one: the people who answer polls are systematically different from those who do not. Response rates have collapsed over the decades — from the vast majority of people contacted to single digits — which means pollsters are weighting a small, unusual slice of the population up to represent everyone.
Then there is the shy voter problem: people who misreport their intentions, whether from embarrassment or distrust. There are late deciders who genuinely make up their minds after the last poll. And there are herding incentives: pollsters who nudge their numbers toward the consensus to avoid being the outlier. None of this means polls are useless — they remain the best systematic window into public opinion we have — but it means every poll deserves a raised eyebrow and a look at the fine print.
A Brief History of Famous Polling Misses
Polling’s most famous failure is also its oldest: the 1936 Literary Digest poll, which predicted Alf Landon would crush Franklin Roosevelt based on 2.4 million responses — the largest poll ever conducted at the time. Roosevelt won in a landslide. The problem was the sample: drawn from phone books and car registrations during the Great Depression, it systematically excluded poorer voters who backed Roosevelt. Bigger was not better; representative was better. A young George Gallup, using a far smaller but properly sampled poll, called it right — and modern polling was born.
The 1948 “Dewey Defeats Truman” headline is the most photographed miss in history. Pollsters had stopped polling weeks before the election, assuming late movement was impossible, and missed Truman’s surge. The lesson — keep polling until the end — seems obvious now, but it had to be learned the hard way, on front pages across America.
More recent misses have subtler causes. In several recent election cycles, polls systematically underestimated one side’s support, and post-mortems pointed to the same culprits: differential nonresponse (supporters of one candidate simply do not answer polls at the same rate), faulty likely-voter models that misjudged who would turn out, and weighting schemes built on outdated assumptions about the electorate. Each miss has made methodology more transparent — today’s serious pollsters publish detailed methodology statements precisely because the failures demanded it.
The pattern across a century of misses is consistent: polls fail when the sample stops resembling the electorate, and the sample stops resembling the electorate when the world changes faster than the methods. Landlines faded, response rates collapsed, voting coalitions shifted — and each time, pollsters had to rebuild the machinery. Healthy skepticism of any single poll, combined with respect for well-conducted polling in aggregate, is the rational response to this history.
Worked Example: Reading a Real Poll Critically
Let me put the checklist to work on a hypothetical but typical poll: “Candidate A leads Candidate B 47% to 44% among likely voters, margin of error ±3.5 points, conducted October 1–4 by phone and online, n=1,100, sponsored by a news organization.”
First, the headline: a 3-point lead with a ±3.5 margin means this race is a statistical tie. Anyone reporting it as “Candidate A leads” without that caveat is misleading you — the honest headline is “poll finds close race.” Second, the dates: early October polling tells you about early October, and late-breaking events can move numbers. Third, the method: phone plus online is a respectable mixed method, and 1,100 is a solid sample. Fourth, the sponsor: a news organization with a reputation to protect is a good sign — they have no incentive to skew results.
Now the questions a careful reader asks next: what was the likely-voter model? (The pollster should publish this.) What did the full questionnaire ask — was the horse-race question asked before or after a battery of negative questions about one candidate? (Order effects are real.) What was the partisan composition of the sample, and does it match reasonable expectations? None of this requires a statistics degree — it requires the habit of scrolling past the headline to the methodology note. Build that habit and you will be better informed than most cable news panels.
FAQ
How many people need to be surveyed for a poll to be accurate?
Surprisingly few, if the sample is truly random. A well-conducted poll of 1,000 people has a margin of error around ±3 points — doubling the sample to 4,000 only shrinks it to about ±1.5. Quality of sampling matters far more than raw size.
What is the difference between a poll and a survey?
A survey is the general method — asking questions of a group. A poll is a specific type of survey, usually short and focused on public opinion or elections, often repeated over time for tracking.
Why do different polls show different results?
Different samples, different likely-voter models, different weighting choices, different question wording, and different dates. Disagreement between pollsters is normal; look at the average across many polls.
Are online polls reliable?
It depends on the panel. High-quality online panels that recruit and weight carefully can be as good as phone polls. Opt-in polls on websites or social media, where anyone can click, are essentially worthless for measuring public opinion.
What does “margin of error” not cover?
It covers only sampling error. It does not account for biased question wording, unrepresentative samples, wrong turnout models, or dishonest answers — all of which can make a poll wrong beyond its stated margin.
Should I trust a poll paid for by a candidate?
Treat it as a campaign document, not a neutral measurement. Internal polls can be methodologically sound, but campaigns only release the ones that help them. Independent pollsters with transparent methods deserve more trust.
Conclusion
Polls and surveys work through careful sampling, honest weighting, and transparent methods — and they fail when any of those break down. The numbers in a headline are the least informative part; the method section is where the truth lives. Read the sample size, the dates, the sponsor, and the questions, average across pollsters, and you will understand public opinion better than most of the people arguing about it online. That is the whole game.